November gets bigger, December gets three weekends.
BFCM now falls entirely in November, shifting Cyber Monday out of December. Expect tougher December comps, offset by three full weekends before Christmas.
Chapter 02 →
Seven questions about how you run the season, scored against the 2026 playbook. It takes a minute and shows you exactly where the money is leaking.
You need it by {{ rDeadlineLabel }}. That's {{ rDeadlineDays }} days from today.
Daniel goes through your three leaks with your real numbers and leaves you with a scale, hold, reduce or pause call on every channel. Your answers come with you, so you don't repeat yourself.
Seven structural shifts landed at once. Every figure is sourced. Tap ♡ on the ones that hit you and we'll start the call there.
We'll score your BFCM against all seven, live on the call, starting with the ones you saved.
Some of the playbook was a September job. Most of what moves BFCM revenue is still in your control, if it happens in the right order.
This year's edition carries more data than last year's, because more changed. The chapters build in the order you should work through them: the market, then the shopper, then the channels, then the plan.
The backdrop every offer, budget and forecast has to survive.
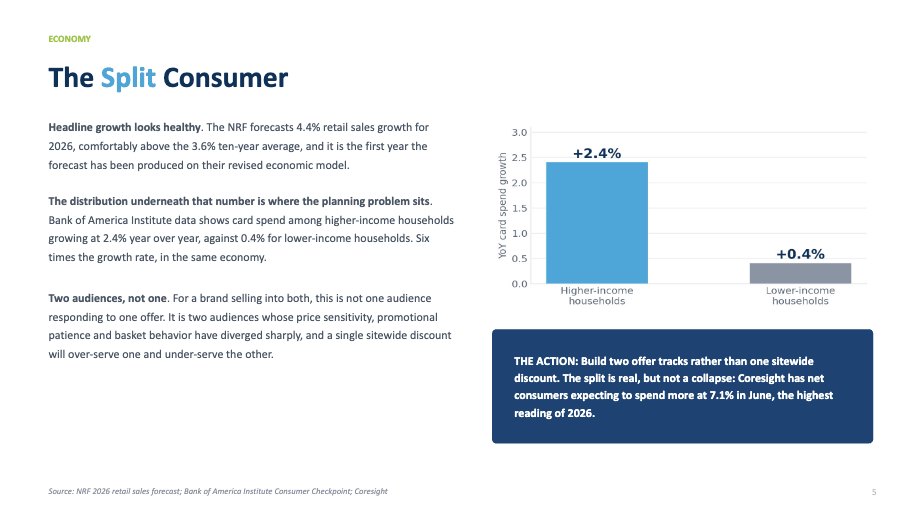
The NRF forecasts 4.4% retail sales growth for 2026, comfortably above the 3.6% ten-year average, and the first year the forecast has been produced on their revised economic model.
Underneath, Bank of America Institute data shows card spend among higher-income households growing 2.4% year over year, against 0.4% for lower-income households. Six times the growth rate, in the same economy.
Two audiences, not one. For a brand selling into both, price sensitivity, promotional patience and basket behavior have diverged sharply. A single sitewide discount will over-serve one and under-serve the other.
Source: NRF 2026 retail sales forecast; Bank of America Institute Consumer Checkpoint; Coresight
Tariff policy moves faster than consumer psychology. Even where duties have eased, the expectation of higher prices persists, and that expectation is what shapes behavior through Q4. Google's holiday research found deep promotions did not push consumers toward cheaper products. Shoppers used the promotion to buy a better product than they otherwise would have.
Source: Google holiday research; eMarketer; Braze BFCM Consumer Trends 2026
Record volume, but the behavior underneath it is the real story.
Judged on top-line, it was a record. Judged on how that revenue arrived, it was a warning. Six structural changes showed up at once, and each makes 2026 harder to execute than a repeat of last year's plan.
Source: Triple Whale BFCM benchmark, 33,000 stores
Black Friday falls on November 27, 2026, giving retailers 28 shopping days until Christmas, one more than 2025. Cyber Monday falls on November 30, versus December 1 last year, so BFCM revenue now lands entirely in November.
December may initially look softer year over year simply because Cyber Monday moved. Its advantage: three clean December weekends for weekend promotions, gifting campaigns, urgency messaging, shipping-cutoff offers and last-minute pushes.
Demand now builds for weeks before the window opens. The obvious read is that BFCM has been hollowed out and the money moved to October. That conclusion is wrong, and acting on it will cost you the window: Cyber Five actually regained its share of total holiday ecommerce in 2025, the first gain since its 2019 peak.
Source: Triple Whale; Google holiday research; BigCommerce 2026 Holiday Trends
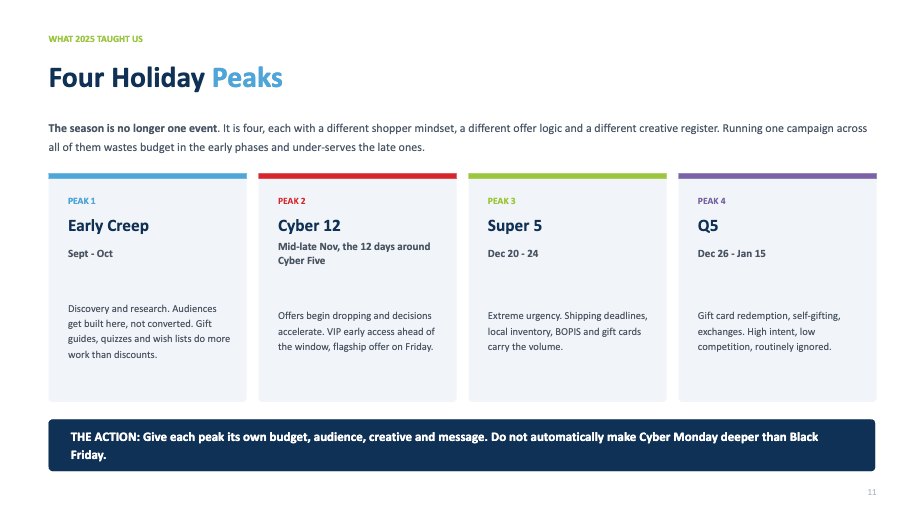
Each peak has a different shopper mindset, offer logic and creative register. One campaign across all four wastes budget early and under-serves the late ones.
An 11.7-point drop in a single season. The first work of BFCM is no longer media planning, it's segmentation. Acquisition still matters, but it's now the smaller half of the equation and the more expensive one.
Source: Triple Whale BFCM benchmark
Black Friday peaked at 1 PM and Cyber Monday at 2 PM, but Saturday peaked at 3 AM and Sunday at 4 AM. A brand reviewing performance once each morning is making budget decisions roughly eight hours after the moment that mattered, on two of the four days.
Source: Triple Whale BFCM benchmark
The channel that reversed direction, and the readiness gap it exposed.
Growth that size off a small base invites a fair objection: large percentages on small numbers are easy to produce. That objection held a year ago. It doesn't now, because the second thing that changed was quality, not just volume.
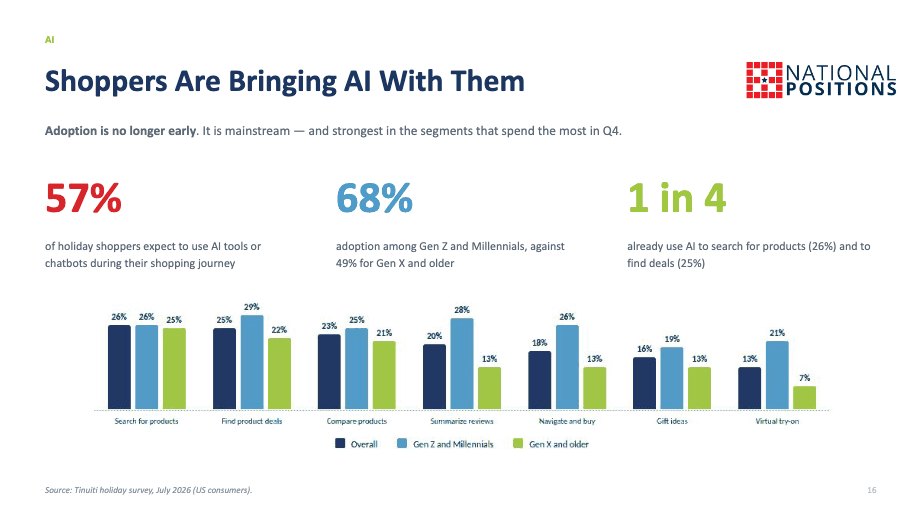
Consumer adoption backs it: Attentive puts 67% of shoppers using AI somewhere in the shopping process, Klaviyo has more than half planning to use it this season, and Similarweb finds 35% of US consumers using AI at product discovery, against 13.6% using conventional search.
Source: Adobe Q1 2026 AI Traffic Report; Attentive; Klaviyo; Similarweb
Source: Tinuiti holiday survey, July 2026 (US consumers)
A year ago, shoppers arriving from AI tools converted worse than direct traffic, roughly 23% worse at Prime Day 2025. As of Q1 2026 they convert 42% better than direct.
Prime Day 2026 confirmed it outside the holiday window, with AI-referred shoppers converting 40% better than site average. A reversal that holds across two very different events in the same year is structural, not seasonal.
Source: Adobe Q1 2026 AI Traffic Report; Adobe 2026 Prime Day Insights
Adobe found roughly 34% of retailer homepage content is not machine-readable. This isn't a creative problem, and writing more content won't solve it. It's structural: product schema, crawlable text rather than text baked into images, complete feed attributes, and specs a model can parse and compare.
It's also a September job. Schema and feed work has to be crawled, indexed and reflected in model outputs before it affects anything, and that doesn't happen on a two-week timeline in November.
Source: Adobe Q1 2026 AI Traffic Report; Salesforce 2026 Holiday Predictions
Planning against last year's assumptions will point effort at the wrong platform.
Universal Commerce Protocol launched at NRF in January with Shopify, Etsy, Wayfair, Target and Walmart, endorsed by Visa, Mastercard, Stripe and Amex. By May a cross-retailer Universal Cart spanned Search, Gemini, YouTube and Gmail, with Affirm and Klarna in Google Pay. The merchant remains merchant of record.
Instant Checkout was pulled in March, about six months after launch. Fewer than ~15 Shopify merchants ever went live, and Walmart measured in-chat checkout converting around three times worse than a click through to walmart.com. ChatGPT pivoted to discovery-first with retailer apps.
Rufus was retired in May and merged with Alexa+ into Alexa for Shopping. It now sits in the main search bar, free to every signed-in US customer with no Prime or Echo requirement, and buys automatically at target prices.
Source: Google Shopping announcements 2026; CNBC, March 2026; GeekWire, May 2026
With overnight peaks on two of four days, the gap between something happening and someone noticing is where margin is lost. The highest-value use of AI isn't content generation. It's compressing the time between a signal appearing and a decision being made on it.
What happened overnight? Revenue against forecast, winners and losers by campaign and SKU, inventory risk, and the budget moves that need to happen before 10 AM.
Are we tracking to target? What changed since this morning? Where should budget shift, and which creative is accelerating right now?
Full-day review, tomorrow's forecast, inventory outlook, promotion performance, and the overnight budget plan for the hours nobody is watching.
A different funnel stage, and an assistant that moved into the search bar.
Read as channel efficiency, Amazon's numbers suggest budget should move. Read correctly, the CPA is low because Amazon shoppers arrive already deep in the funnel. The platform mostly converts marketplace intent that already exists.
So Amazon budget can't be scaled like a prospecting channel. Beyond a point, spending more doesn't find more intent. It just pays more to capture the same intent.
Source: Triple Whale BFCM benchmark
In May 2026 Amazon retired the Rufus brand and merged it with Alexa+. It moved from a side panel most shoppers ignored into the main search bar, free to every signed-in US customer with no Prime or Echo required.
Purchases automatically when a tracked product reaches a customer's target price, with no return visit.
Standing recurring purchases handled on the customer's behalf, removing replenishment from the browse cycle.
Completes purchases at off-Amazon retailers, extending the assistant beyond Amazon's own catalog.
A growing share of demand now resolves inside the assistant's answer rather than on a results page. The inputs it reads become the ranking factors: catalog hygiene, structured attributes, review depth and PDP completeness.
Source: Amazon Ads agentic shopping guidance, June 2026; GeekWire, May 2026
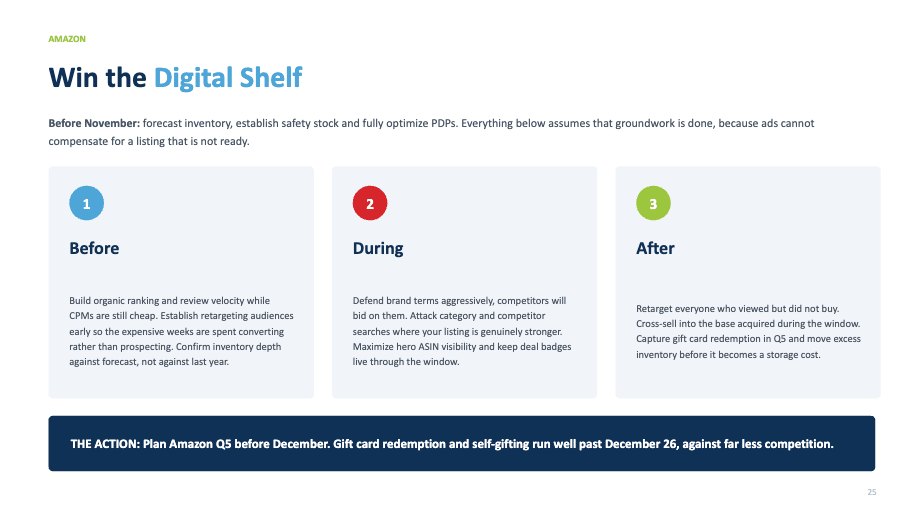
Before November: forecast inventory, establish safety stock and fully optimize PDPs. Everything below assumes that groundwork is done, because ads cannot compensate for a listing that isn't ready.
Where the dollars went, what they returned, and how to pace a shorter season.
The two smallest channels by spend delivered the lowest acquisition costs. That isn't necessarily wrong, since Meta carries prospecting volume the others can't, but it leaves the portfolio exposed to one platform's auction during the most expensive weeks of the year. Meta and Google both lost share in 2025; emerging platforms gained it.
Source: Triple Whale BFCM benchmark, 33,000 stores
That kind of movement usually triggers a budget cut. Before making one, separate the account: blended ROAS mixes brand search, non-brand, Shopping, Performance Max and Demand Gen. Brand search will always report well; it captures demand created elsewhere, flatters everything around it, and hides whether prospecting is actually working.
Rising returns alongside falling costs is unusual and typically short-lived: an ad product that matured faster than advertiser demand caught up. At 3.66% of spend, most brands still treat it as an experiment. Repurposed Meta assets underperform badly here.
"Don't make TikTok ads. Make TikToks that happen to sell products."Shoppers buying gifts directly on social nearly doubled in a year, from 12% in 2024 to 21% in 2025. US social commerce passes $100 billion in 2026, growing 18% year over year. TikTok Shop alone drove around $500 million GMV over the BFCM weekend, with brands above $10M growing 76%.
The measurement implication matters more than the growth: media and storefront have different economics, attribution paths and margins. Blended into one line, they hide each other.
Source: eMarketer holiday outlook 2026; Pinterest 2026 seasonal guide; Adobe
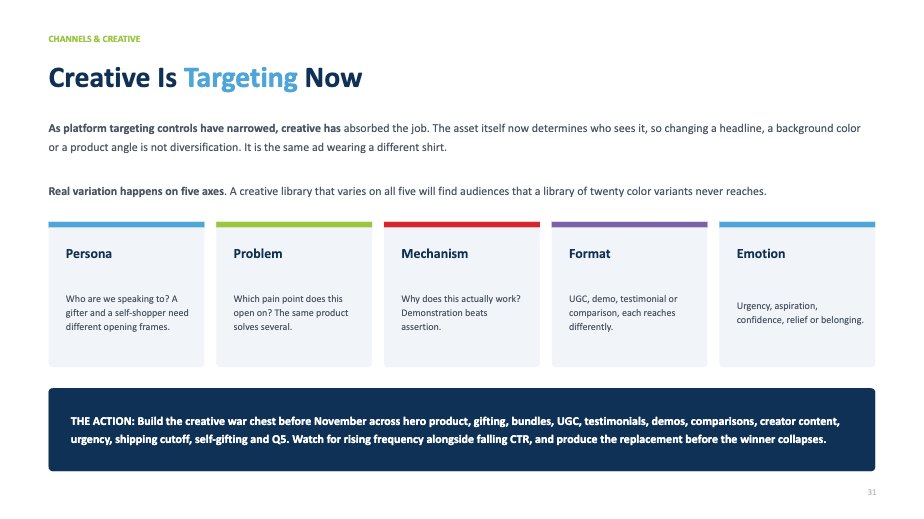
As targeting controls narrowed, the asset itself started deciding who sees it. A new headline, background color or product angle isn't diversification. It's the same ad wearing a different shirt.
Who are we speaking to? A gifter and a self-shopper need different opening frames.
Which pain point does this open on? The same product solves several.
Why does this actually work? Demonstration beats assertion.
UGC, demo, testimonial or comparison. Each reaches differently.
Urgency, aspiration, confidence, relief or belonging.
{{ pacingNote }}
Illustrative weekly spend shapeBudget shape matters more in a compressed season. A cold-started account typically needs 24 to 48 hours to stabilize, time that doesn't exist inside a four-day window.
Source: Meta Holiday Playbook 2026; agency spend-curve analysis
Decide what good looks like before they do.
Summed platform-reported revenue routinely exceeds what's actually in Shopify, sometimes by a wide margin.
This isn't a bug in any single platform. Each reports honestly within its own attribution window and view of the journey. Those views overlap, and nobody reconciles them.
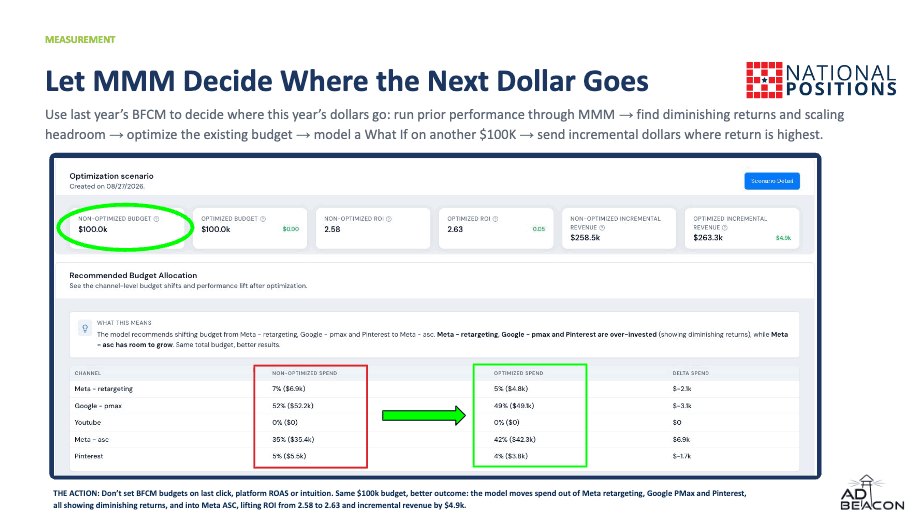
The model moves spend out of Meta retargeting, Google PMax and Pinterest, all showing diminishing returns, and into Meta ASC, which has room to grow. Same total budget, better results.
Not on Friday morning while everyone stares at dashboards. Once the window opens, there's no time to agree on definitions, and decisions get made on whichever number is loudest.
No single metric answers the question alone. The stack matters more than any one layer, and AdBeacon is where we run it in one place.
First-party, server-side performance data is the foundation. Platform numbers are claims made by the platform grading its own homework.
In practice: consolidate every channel against one first-party click datasetConnect the accounts by API so the plan is built on what actually happened, not last year's assumptions. Know where, when and how the next dollar should go.
In practice: build the plan at campaign and SKU level, not channel levelWrite the pivot plans before the window opens. If pacing turns red Friday morning, the alternative budget shape and its trigger should already exist.
In practice: define reallocation triggers numerically, in SeptemberSeptember is the test window. Trial promotions, products, audiences and channels so Q4 harvests something proven, not something learned at peak CPMs.
In practice: build interest now, harvest it in Q4Book the walkthrough and get 30 days of AdBeacon, our attribution and tracking platform. One first-party, cross-channel view of what's actually driving incremental revenue, live before Black Friday.
Pixels record what happened. They don't record why. A post-purchase survey fielded within 24 hours captures attribution no measurement stack can reconstruct, and during BFCM, when attribution is noisiest, it's often the cleanest signal available.
Four shoppers, offer architecture, and the checkout most of them will use.
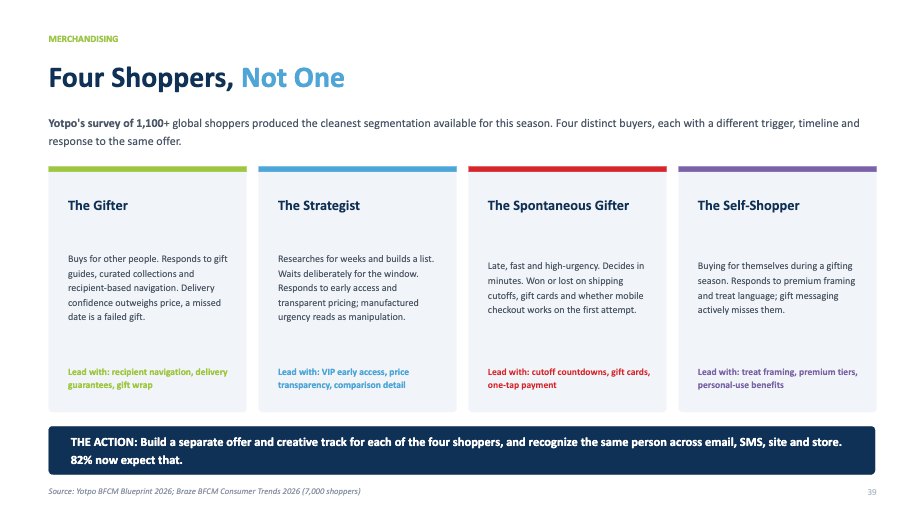
Yotpo's survey of 1,100+ global shoppers produced the cleanest segmentation available for this season: four distinct buyers, each with a different trigger, timeline and response to the same offer.
Source: Yotpo BFCM Blueprint 2026; Braze BFCM Consumer Trends 2026 (7,000 shoppers)
Price skepticism ranks among the top trends in Braze's 7,000-shopper study across five markets. Shoppers assume the pre-sale price was inflated, and they validate before buying. Once that assumption is in place, deeper discounting stops persuading.
What moves them is evidence: reviews, comparison detail, guarantees, stated delivery dates, return terms and visible social proof. Validation signals now do more conversion work than another five points off.
Structure matters as much as depth. A descending ladder, with the strongest offer going to VIP early access and then holding, outperformed escalating discounts in 2025. Early-access buyers spent roughly 2× per order, with 65% higher open rates on the access email.
Source: Braze BFCM Consumer Trends 2026; Yotpo; Growth Suite
A percentage gets picked, applied sitewide, and the margin consequences are discovered in January. An offer architecture inverts that: the economics are set first, and the promotion is built inside them.
The deepest discount does not automatically produce the greatest profit.
Revenue records are easy to set and expensive to celebrate.
Each lifts AOV without cutting the headline price, protecting both margin and price perception into Q1.
Not a variant of it. Every extra second of load time and every extra checkout step gets more expensive at peak, because the traffic arriving is more expensive. The pre-season test isn't a Lighthouse score. It's buying your own product, on a real phone, with a real discount code, and watching what breaks.
Source: Salesforce Cyber Week data; Shopify
Where each workstream has to land, and by when.
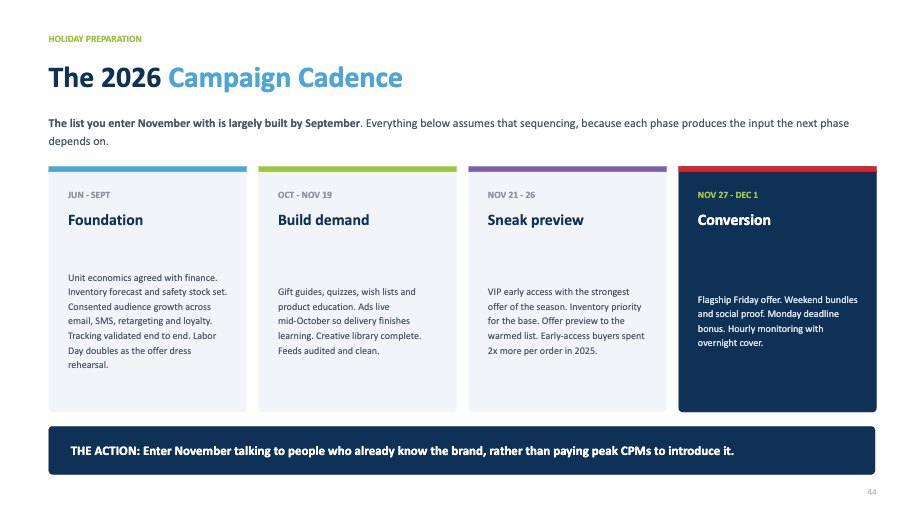
The list you enter November with is largely built by September. Each phase produces the input the next one depends on.
Unit economics agreed with finance. Inventory forecast and safety stock set. Consented audience growth across email, SMS, retargeting and loyalty. Tracking validated end to end. Labor Day doubles as the offer dress rehearsal.
Gift guides, quizzes, wish lists and product education. Ads live mid-October so delivery finishes learning. Creative library complete. Feeds audited and clean.
VIP early access with the strongest offer of the season. Inventory priority for the base. Offer preview to the warmed list. Early-access buyers spent 2× more per order in 2025.
Flagship Friday offer. Weekend bundles and social proof. Monday deadline bonus. Hourly monitoring with overnight cover.
Bad data becomes extraordinarily expensive during BFCM, because every error is multiplied by peak traffic and peak CPMs.
The playbook above isn't theory. It's what we ran for these brands. Scroll through.
Holiday pressure into growth. Heavy Q4 seasonality with the Advent Calendar as hero, rising brand-search CPCs, creative gaps in paid social, thin seasonal SEO authority, and a St. Regis partnership to integrate.

Augason Farms, founded in 1972 and already in US homes, had strong recognition but stalled growth: low repeat purchase, conversion drop-off, over-reliance on branded search, and Amazon channel conflict eroding margins. We built a system where acquisition fuels retention and CRO multiplies every step.
The Net Return makes premium sports nets for pros and recreational players. They saw BFCM as the moment to elevate presence and capture demand, and needed one cohesive strategy across Amazon and Meta.

Brixton wanted to refresh the entire strategy, not just acquisition, with a laser focus on lifetime value. Over five years they scaled from $2M to $20M a year, and were more profitable at 20 than at 2.
LifeCell South Beach is clinically backed luxury skincare with strong DTC demand and a loyal base, but zero email program: no flows, campaigns, segmentation or Klaviyo. Amazon listings were underperforming the premium positioning.
Glenn Avenue had a strong voice and weak revenue rhythm: underperforming email and SMS, low automation contribution, no pop-up or list-growth funnel, and seasonal blind spots. We rebuilt flows around storytelling, not discounts.

Wine Racks America sells customizable wine storage to homes and businesses: rising Google CPCs, a 60-day closing cycle on high-AOV custom projects, and buyers who convert both online and offline.
A fitness accessories brand that went from niche startup to market leader, competing for visibility against established players and a diverse, fitness-savvy audience.
Metal Tech 4x4 sells aftermarket 4x4 and off-road parts, scaled through a long-running paid search engagement.


Klaviyo
They care about results. You can feel it in every meeting and every campaign.
Hands-on, ROI-focused, and incredibly responsive. Couldn't ask for more.
Their data-driven approach has given us real confidence that our marketing spend is being maximised for the best possible ROI.
If you are running an eCommerce business then National Positions is a must if you want to scale your business!
The brands that win this season will have integrated data, loyalty and retention long before the window opens. Here's how the National Positions team runs it with you.
Revenue pacing and budget reviewed weekly or daily, with channel-specific opportunities to shift spend into performance and alerts when scaling headroom appears.
Weekly creative review, pivot strategies and A/B testing insight, so fatigue is caught before it costs you the window rather than after.
Our proprietary attribution platform gives one consistent cross-channel view of what's actually driving incremental revenue, held steady through the season.
Morning, midday and evening intelligence briefs across Google, Meta, TikTok, Amazon, Shopify, GA4 and Klaviyo, including the overnight hours when two of four BFCM days peak.
The playbook tells you what changed. The check shows where it hits {{ brandPossLower }} store. The walkthrough turns both into a plan you can run before {{ rDeadlineShort }}.

It's a working session. We go through your numbers against the seven shifts and tell you what we'd change. If we're a fit, we'll say so. If not, you keep the plan.
Then treat this as a second opinion. A fresh read on pacing, offer structure and attribution weeks before Black Friday costs you 30 minutes. Most of what we cover is the plan, which your agency can run.
Some of it, yes: schema and feed work was a September job. But segmentation, VIP early access, product-level pricing, overnight monitoring, December's three weekends and Q5 are all still ahead of you. That's where we start.
Ideally last year's BFCM results by channel, plus your current budget and promo calendar. If you took the check above, your answers come with the booking.
We've worked with 1,600+ brands, from teams building their first lifecycle program to Brixton's growth from $2M to $20M a year. We work with ecommerce brands doing $1M a year and up.
Our proprietary attribution platform. It holds one first-party, cross-channel view across Google, Meta, TikTok, Amazon, Shopify, GA4 and Klaviyo, and feeds the morning, midday and evening briefs we run through BFCM. Book the walkthrough and you get 30 days of it free.